
BRICS Summit 2026: Navigating Trade Imbalances Under India’s Chairship
Sagnik Samadder
Senior Research Associate
KEY TAKEAWAYS
- Growing trade. India’s trade with BRICS members rose by 12.4%, from $387.3 billion in 2022 to $435.3 billion in 2025, about a fifth of the bloc’s growth.
- Leading trader, key market. India is the bloc’s second-largest trader (15.2% share) and a major buyer for the UAE, Saudi Arabia and Russia, which gives it leverage for market access.
- Export gains. Exports rose by 23.4% to the UAE under the CEPA, 53.6% to Russia and 19.9% to China from 2022-2025.
- Sectoral strengths. India leads the bloc’s exports of pharmaceuticals, rice, and gems and jewellery, and earns surpluses in pharmaceuticals, rice and marine products.
- But import-led. Imports from the BRICS nations rose by 15.7% against 2.2% for exports to the BRICS nations, widening the deficit from $199.5 billion to $243.4 billion.
- Concentrated deficit. China and Russia accounted for about 78% of the deficit, mainly manufactured inputs and crude oil.
- Measurable outcomes matter. The New Delhi Declaration sets no numerical targets; its success should be judged by gains in exports and domestic value addition.
Source for figures: World Bank WITS (author’s computations)
1. INTRODUCTION
India hosted the 18th BRICS Summit in New Delhi on 12-13 September 2026 under the theme “Building for Resilience, Innovation, Cooperation and Sustainability.” The summit culminated in the adoption of the New Delhi Declaration, which outlines a broad agenda for strengthening trade, investment, production networks, and financial cooperation among the grouping’s 11 members.
The Declaration provides a framework for deeper economic integration, encompassing market access, global value chains, MSME finance, customs cooperation, digital trade, and cross-border payments. However, the extent to which these commitments will improve India’s trade performance remains uncertain. India’s merchandise trade with BRICS members has expanded, but its imports have grown at a considerably higher rate than its exports. The central policy challenge is therefore to translate greater trade integration into stronger export competitiveness, higher domestic value addition, and more diversified participation in regional and global production networks.
The Trade Architecture of the New Delhi Declaration (BRICS Summit 2026): The Declaration builds an ecosystem around trade, from production and finance to customs, payments and logistics, as the sequence below shows. Its trade-related provisions, and what each means for trade, are summarised in the Annexure at the end of this article.
Trade → GVCs → MSMEs → Trade finance → Customs → Digital trade → Payments → Investment Platform → PPPs → Insurance → Growth Task Force
2 INTRA-BRICS TRADE: THE BLOC'S TOTAL, ITS LARGEST CONTRIBUTORS AND INDIA'S POSITION
Before turning to India’s own figures, it helps to place India within the bloc’s trade as a whole. Trade among the 11 BRICS members, measured by members’ exports to one another, rose from $1,209.3 billion in 2022 to $1,357.4 billion in 2025, an increase of 12.3%. Counting each member’s exports and imports, members’ combined trade with one another reached $2,857.2 billion in 2025, and their trade with the ten partner countries a further $1,009.4 billion.
Table 1: Largest contributors to intra-BRICS trade, 2025
Rank | Country | Total trade 2022 (US$ billion) | Total trade 2025 (US$ billion) | Change (%) | Share of intra-BRICS trade, 2025 (%) | Exports 2025 (US$ billion) | Imports 2025 (US$ billion) | 2025 Deficit/ Surplus (US$ billion) | Exports as % of imports, 2025 |
1 | China | 936.9 | 1,055.4 | 12.7 | 36.9 | 590.2 | 465.3 | 124.9 | 126.8 |
2 | India | 387.3 | 435.3 | 12.4 | 15.2 | 95.9 | 339.4 | -243.4 | 28.3 |
3 | Russia | 269.1 | 321.7 | 19.6 | 11.3 | 209.1 | 112.6 | 96.5 | 185.7 |
4 | UAE | 242.3 | 270.8 | 11.8 | 9.5 | 113.5 | 157.3 | -43.9 | 72.1 |
5 | Brazil | 215.2 | 230.7 | 7.2 | 8.1 | 128.4 | 102.3 | 26.2 | 125.6 |
6 | Indonesia | 199.3 | 209.6 | 5.2 | 7.3 | 102.4 | 107.2 | -4.8 | 95.5 |
7 | Saudi Arabia | 152.3 | 186.1 | 22.2 | 6.5 | 72.4 | 113.6 | -41.2 | 63.7 |
8 | South Africa | 70.1 | 65.1 | -7.2 | 2.3 | 25.5 | 39.5 | -14.0 | 64.6 |
9 | Egypt | 50.5 | 60.7 | 20.3 | 2.1 | 14.3 | 46.5 | -32.2 | 30.7 |
10 | Iran | 68.8 | 15.4 | -77.6 | 0.5 | 4.1 | 11.3 | -7.2 | 36.0 |
11 | Ethiopia | 8.4 | 6.3 | -24.9 | 0.2 | 1.6 | 4.7 | -3.1 | 33.6 |
| Total | 2,600.0 | 2,857.2 | 9.9 | 100 | 1,357.4 | 1,499.8 | -142.3 | 90.5 |
Source: World Bank WITS; author’s computations.
This trade is highly concentrated: in 2025, China alone accounted for 36.9% of it, and China, India and Russia together for about 63%. China also accounted for 46.1% of the increase in the bloc’s trade between 2022 and 2025. China is thus the main driver of intra-BRICS trade and the leading exporter to the other members, with shipments of $590.2 billion in 2025. Its strength lies in manufacturing: mechanical and electrical products made up more than 60% of China’s total exports in 2025 for the first time, and exports of electric vehicles, lithium batteries and solar products rose by 27.1%. India ranked second only because of the size of its imports, while Russia ranked third, driven by its energy exports: fuel and energy products made up 53.9% of its exports in 2025.
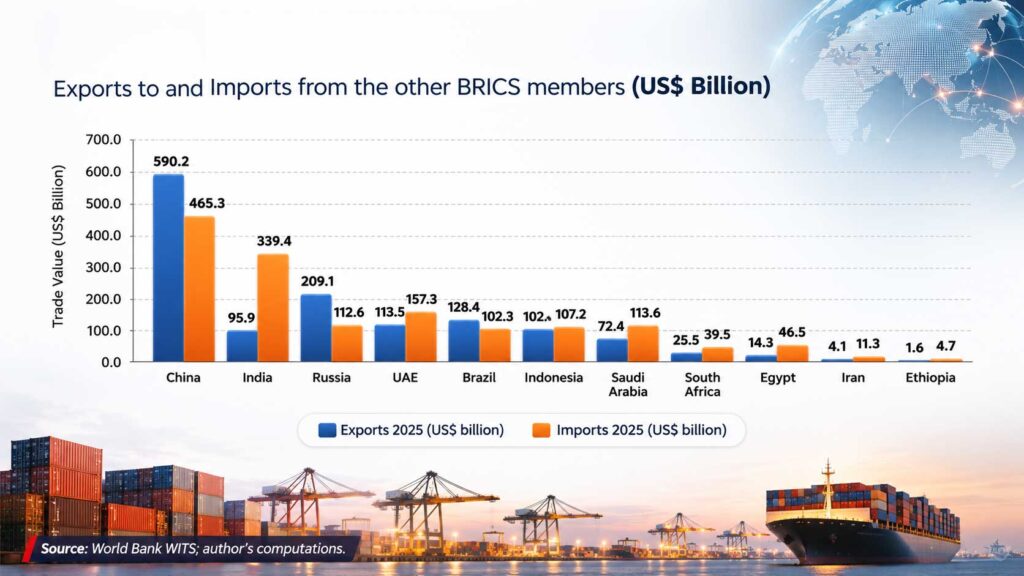
Chart 1: Exports to and imports from the other BRICS members, 2025 (US$ billion)

Source: World Bank WITS; author’s computations.
Chart 1 compares each member’s exports to, and imports from, the other members. India’s imports from the bloc ($339.4 billion) are more than three times its exports ($95.9 billion), giving India the largest deficit among the 11 members ($243.4 billion).
Chart 2: Exports as a percentage of imports in trade with the other BRICS members, 2025
Source: World Bank WITS; author’s computations.
Chart 2 shows each member’s exports as a percentage of its imports in trade with the other members, also called the export-import coverage ratio. It is calculated by dividing a country’s exports to the other members by its imports from them. A value of 100% means trade is balanced; a value below 100% means a deficit. India’s ratio of 28.3% means that for every $100 of imports from BRICS members, India exports about $28 to them. This is the lowest ratio in the bloc, below Egypt (30.7%) and Ethiopia (33.6%), and down from 32.0% in 2022. Because the ratio is not affected by the size of a country’s trade, it allows India to be compared with smaller members; identifying the drivers of the imbalance, however, requires the sector-level analysis presented later in this article.
China ($124.9 billion), Russia ($96.5 billion) and Brazil ($26.2 billion) ran surpluses with the bloc in 2025, as each supplies goods that the other members need in large volumes while buying comparatively little from them. China exports manufactured and capital goods, such as machinery, electronics and green-energy equipment, and imports mainly raw materials and energy from the bloc. Russia exports crude oil, petroleum products, coal and gas, chiefly to China and India, while sanctions have constrained its imports. Brazil exports commodities in which it is highly competitive: crude oil (12.8% of its exports in 2025), soybeans (12.5%) and iron ore (8.3%), with China taking 79.3% of its soybean exports and 45% of its crude oil exports. Their surpluses therefore reflect two factors. The first is the composition of their exports. The second is that the bloc itself provides large and assured markets for those exports: China and India together absorb much of Russia’s energy, and China takes most of Brazil’s soybeans. In that sense, BRICS does give these countries better market access, but this access arises from complementary demand, with energy- and commodity-importing members buying from commodity exporters, rather than from preferential tariffs, since the bloc has no common trade agreement. India, whose exports to the bloc are mainly manufactures that compete with Chinese goods, does not benefit in the same way.
2.1 INDIA'S POSITION WITHIN THE BLOC
- India is the bloc’s second-largest trader, with its position driven primarily by imports rather than exports. India accounted for 15.2% of intra-BRICS trade in 2025, up from 14.9% in 2022, behind only China. It represented 22.6% of the bloc’s imports, again second only to China, but supplied only 7.1% of its exports, ranking sixth among the 11 members.
- India is a major driver of the bloc’s trade growth. India’s trade with the other members rose by $48.1 billion between 2022 and 2025 (from $387.3 billion to $435.3 billion), or 18.7% of the bloc’s total increase of $257.2 billion, third behind China ($118.6 billion) and Russia ($52.7 billion).
- India is an important market for several members. In 2025, India accounted for about 49% of the UAE’s exports to the other members, 43% of Saudi Arabia’s, 33% of South Africa’s, 30% of Russia’s and 25% of China’s. For the Gulf members and Russia, this dependence rests mainly on India’s purchases of crude oil and petroleum products, and for South Africa partly on gold (Table 4). In Russia’s case it has deepened since 2022, as India’s imports from Russia rose by 54.7% (Table 2). Because these members rely on Indian demand for a large part of their intra-BRICS sales, India has leverage to seek reciprocal market access for its own goods under the Declaration’s trade provisions, although its need for secure energy supplies limits how far that leverage can be used.
3 INDIA'S TRADE WITH BRICS MEMBERS: AN IMPORT-LED PATTERN
The aggregate deficit is highly concentrated. China and Russia alone accounted for about 78% of India’s BRICS trade deficit in 2025 ($189.8 billion of $243.4 billion); China’s share was 54%. Saudi Arabia ($20.5 billion) and the UAE ($17.1 billion), both major oil suppliers, accounted for a further 15%.
3.1 DISTRIBUTION OF INDIA'S TRADE DEFICIT ACROSS BRICS MEMBERS
As Table 2 shows, India’s exports to BRICS members rose by just $2.1 billion (2.2%) between 2022 and 2025, against an increase of $46.0 billion (15.7%) in imports. As a result, the trade deficit widened by 22.0%, and it did so in every year of the period: from $199.5 billion in 2022 to $213.8 billion in 2023, $231.1 billion in 2024 and $243.4 billion in 2025. The growth in India’s trade with the bloc was therefore driven by imports, with exports displaying only modest growth. On the import side, discounted Russian crude, rising purchases of electronic components and machinery from China to supply domestic assembly, and higher gold prices pushed up the import bill. On the export side, the fall in petroleum product prices from their 2022 peak reduced the value of India’s refined-fuel shipments, restrictions on exports of non-basmati white rice between July 2023 and September 2024 curbed food exports, and exports to Indonesia, Brazil and South Africa declined sharply.
Table 2: India's trade with each BRICS member, 2022 and 2025
Sl. No. | Country | Exports 2022 (US$ billion) | Exports 2025 (US$ billion) | Exp. Change (%) | Imports 2022 (US$ billion) | Imports 2025 (US$ billion) | Imp. Change (%) | 2025 Deficit/ Surplus (US$ billion) | FTA Status |
1 | Brazil | 9.72 | 6.93 | -28.7 | 7.12 | 7.68 | 8.0 | -0.75 | India-Mercosur PTA (limited); expansion talks agreed |
2 | China | 15.08 | 18.09 | 19.9 | 102.25 | 149.49 | 46.2 | -131.41 | No FTA; none under negotiation |
3 | Egypt | 4.09 | 3.97 | -3.0 | 2.80 | 1.41 | -49.7 | 2.56 | No FTA |
4 | Ethiopia | 0.61 | 0.47 | -23.0 | 0.05 | 0.22 | 351.6 | 0.25 | No FTA |
5 | Indonesia | 9.87 | 4.33 | -56.1 | 28.67 | 21.21 | -26.0 | -16.88 | No bilateral FTA; ASEAN-India FTA (goods) applies |
6 | Iran | 1.84 | 1.21 | -34.4 | 0.65 | 0.93 | 42.5 | 0.28 | No FTA (sanctions constraints) |
7 | Russia | 2.93 | 4.49 | 53.6 | 40.63 | 62.87 | 54.7 | -58.37 | FTA negotiations launched (via EAEU) |
8 | Saudi Arabia | 10.15 | 10.79 | 6.3 | 46.19 | 31.26 | -32.3 | -20.47 | No FTA |
9 | South Africa | 8.27 | 6.99 | -15.4 | 11.17 | 8.52 | -23.7 | -1.52 | No bilateral FTA |
10 | UAE | 31.32 | 38.67 | 23.4 | 53.85 | 55.79 | 3.6 | -17.13 | CEPA in force since May 2022 |
| BRICS members total | 93.89 | 95.94 | 2.2 | 293.37 | 339.39 | 15.7 | -243.45 |
|
Source: World Bank WITS; author’s computations.
- China accounts for more than half of the deficit. India’s exports to China rose by 19.9% between 2022 and 2025, but imports rose by 46.2%, from $102.2 billion to $149.5 billion. The deficit with China widened from $87.2 billion to $131.4 billion. The increase was concentrated in electronic components, machinery and chemicals, which feed India’s own assembly and manufacturing (see Table 4).
- Russia is the second-largest driver of the deficit. Imports from Russia, mainly discounted crude oil, rose by 54.7% to $62.9 billion. Exports grew at a similar rate (53.6%), but from a small base of $2.9 billion in 2022, merely reaching $4.5 billion in 2025. Exports covered only about 7% of imports in both years (7.2% in 2022 and 7.1% in 2025), so similar growth rates widened the gap in absolute terms. The deficit widened from $37.7 billion to $58.4 billion; the proposed India-EAEU free trade agreement could help by lowering tariffs and easing regulatory barriers for Indian goods such as pharmaceuticals, machinery, auto components and farm products, allowing exports to grow from a larger base.
- India-UAE trade performance under the CEPA. The UAE is India’s largest BRICS export market, representing 40% of India’s exports to the bloc in 2025. Exports rose by 23.4%, led by engineering goods, electronics and gems and jewellery (the UAE took 32%, 64% and 96% of India’s exports of these to members; Table 4), while imports rose by only 3.6%, and the deficit narrowed from $22.5 billion to $17.1 billion. This pattern, under a CEPA in force since May 2022, is consistent with improved export performance, although demand and commodity prices may also have contributed.
- Deficits with Saudi Arabia and Indonesia narrowed. Imports from Saudi Arabia declined by 32.3%, largely as crude oil prices eased from their 2022 highs and Indian refiners shifted purchases towards discounted Russian crude; imports from Indonesia declined by 26.0%, mainly reflecting the sharp fall in coal prices after 2022. Exports to Indonesia, however, declined by 56.1%, from $9.9 billion to $4.3 billion, the steepest fall among all members. Exports to Brazil declined by 28.7%, turning a surplus of $2.6 billion in 2022 into a deficit of $0.75 billion in 2025, partly because the high commodity and fuel prices that inflated the value of trade in 2022 subsequently eased.
- India ran trade surpluses with three members: Egypt ($2.56 billion), Iran ($0.28 billion) and Ethiopia ($0.25 billion). Exports to all three declined over the period, so these surpluses reflect low imports rather than export strength. Imports from Ethiopia rose by 351.6%, but from a very small base (from $49.4 million in 2022 to $223.2 million in 2025).
4 INDIA'S TRADE WITH BRICS PARTNER COUNTRIES
Beyond its trade with members, India also trades with the bloc’s ten partner countries, a group dominated by South-East Asian economies. India’s trade with these countries was $71.2 billion in 2025, almost unchanged from $72.1 billion in 2022, but its composition shifted: exports declined by 15.0% while imports rose by 6.4%, so the deficit widened from $20.3 billion to $27.1 billion.
Table 3: India's trade with BRICS partner countries, 2022 and 2025
Sl. No. | Country | Exports 2022 (US$ billion) | Exports 2025 (US$ billion) | Exp. Change (%) | Imports 2022 (US$ billion) | Imports 2025 (US$ billion) | Imp. Change (%) | 2025 Deficit/ Surplus (US$ billion) | FTA Status |
1 | Belarus | 0.04 | 0.06 | 49.7 | 0.17 | 0.07 | -61.0 | <0.01 | EAEU member; FTA negotiations launched |
2 | Bolivia | 0.08 | 0.06 | -27.8 | 2.80 | 0.88 | -68.4 | -0.83 | No FTA |
3 | Cuba | 0.03 | 0.02 | -38.7 | <0.01 | <0.01 | 30.3 | 0.01 | No FTA |
4 | Kazakhstan | 0.44 | 0.20 | -54.8 | 0.12 | 0.74 | 524.5 | -0.54 | EAEU member; FTA negotiations launched |
5 | Malaysia | 7.19 | 6.34 | -11.8 | 13.54 | 12.42 | -8.3 | -6.09 | ASEAN-India FTA (goods); bilateral CECA |
6 | Nigeria | 5.34 | 3.16 | -40.8 | 8.76 | 5.74 | -34.4 | -2.58 | No FTA |
7 | Thailand | 6.04 | 5.06 | -16.2 | 11.25 | 16.52 | 46.9 | -11.46 | ASEAN-India FTA (goods) |
8 | Uganda | 0.59 | 0.42 | -29.1 | 0.46 | 0.17 | -62.9 | 0.25 | No FTA |
9 | Uzbekistan | 0.29 | 0.64 | 125.2 | 0.09 | 0.21 | 124.3 | 0.44 | No FTA |
10 | Vietnam | 5.88 | 6.06 | 3.0 | 9.00 | 12.38 | 37.5 | -6.33 | ASEAN-India FTA (goods) |
| Partner countries total | 25.92 | 22.02 | -15.0 | 46.21 | 49.15 | 6.4 | -27.13 |
|
Source: World Bank WITS; author’s computations. <0.01: below $0.01 billion.
- Three ASEAN members drive the partner-country deficit. Thailand, Vietnam and Malaysia account for 88% of it in 2025. The deficit with Thailand more than doubled, from $5.2 billion to $11.5 billion, as imports rose by 46.9%. This mirrors India’s wider trade with ASEAN: its deficit with the ten-member group rose from about $5 billion in 2010-11, soon after the ASEAN-India goods agreement took effect, to about $45.2 billion in FY25, which is why India is pressing for a review of the agreement.
- India has trade surpluses with Uzbekistan ($0.44 billion), Uganda ($0.25 billion) and Cuba ($0.01 billion). Uzbekistan is the only partner where exports more than doubled (125.2%).
- India’s weight in partner countries’ trade with the bloc is falling. Partner countries’ trade with the 11 members rose from $720.2 billion in 2022 to $940.9 billion in 2025, led by Vietnam, Thailand and Malaysia, which together accounted for 84% of it. India’s share fell from 10.0% to 7.6%, and India slipped from second to third place among the members as a trading partner of these countries, behind China and Indonesia.
- India remains a significant partner for most of them. India is among the top three-member trading partners for nine of the ten partner countries, and accounts for about a quarter (24.6%) of Nigeria’s trade with BRICS members. But India’s exports to partner countries covered only 44.8% of its imports from them in 2025, down from 56.1% in 2022.
5 SECTORAL STRENGTHS AND WEAKNESSES IN INDIA'S TRADE
The country-specific figures show where India’s deficit is concentrated; the sectoral figures show what drives it. Table 4 represents sectoral trends in India’s 2025 trade with the other ten BRICS members and the ten partner countries, using product-level (HS 4-digit) data.
Table 4: India's trade by sector with BRICS members and partner countries, and leading BRICS exporters, 2025 (US$ billion)
Sector | With BRICS members | With partner countries | Main member partners, % share (exports & imports) | Members exporting more than India to the bloc | ||||
Exports | Imports | Balance | Exports | Imports | Balance | |||
Engineering goods | 24.4 | 65.8 | -41.4 | 6.9 | 11.4 | -4.5 | Exp: UAE 32%, Saudi Arabia 20% Imp: China 82%, UAE 7% | China (217.9), Indonesia (32.3); India 3rd |
Petroleum, crude and products | 12.3 | 98.9 | -86.6 | 1.5 | 5.9 | -4.4 | Exp: UAE 49%, China 19% Imp: Russia 50%, UAE 24% | Russia (128.2), UAE (55.5), Brazil (21.7); India 4th |
Electronic goods | 7.3 | 48.3 | -41.0 | 0.3 | 8.6 | -8.3 | Exp: UAE 64%, China 28% Imp: China 99% | China (50.7), Saudi Arabia (14.7, phone re-exports to the UAE); India 3rd |
Drugs and pharmaceuticals | 2.6 | 0.4 | 2.3 | 1.5 | <0.05 | 1.5 | Exp: South Africa 26%, Brazil 23% Imp: China 55%, Indonesia 27% | None; India 1st |
Chemicals (organic, inorganic) | 5.6 | 21.5 | -15.8 | 1.2 | 2.3 | -1.1 | Exp: China 24%, Saudi Arabia 16% Imp: China 61%, UAE 20% | China (17.4); India 2nd |
Gems and jewellery | 9.6 | 11.0 | -1.4 | 0.8 | 4.8 | -4.0 | Exp: UAE 96% Imp: UAE 43%, China 43% | None; India 1st |
Textiles (garments, yarn, fabrics) | 5.0 | 5.4 | -0.4 | 1.2 | 0.9 | 0.2 | Exp: UAE 48%, China 14% Imp: China 81%, Brazil 9% | China (31.4); India 2nd |
Rice | 2.9 | <0.05 | 2.9 | 0.4 | <0.05 | 0.4 | Exp: Saudi Arabia 41%, Iran 26% | None; India 1st |
Marine products | 1.7 | <0.05 | 1.7 | 1.0 | <0.05 | 1.0 | Exp: China 78%, Russia 10% | Russia (3.3); India 2nd |
Vegetable oils | 1.0 | 6.8 | -5.8 | 0.1 | 4.3 | -4.2 | Exp: China 80%, UAE 9% Imp: Indonesia 52%, Russia 30% | Indonesia (11.2), Russia (4.1); India 3rd |
Gold | 0.1 | 20.0 | -19.9 | <0.05 | 0.9 | -0.9 | Exp: UAE 99% Imp: UAE 81%, South Africa 11% | UAE (23.3), South Africa (12.0), Egypt (5.9) and four others; India 8th |
Fertilisers | 0.1 | 8.4 | -8.3 | <0.05 | 0.5 | -0.5 | Exp: Brazil 74%, UAE 15% Imp: Russia 35%, Saudi Arabia 30% | Russia (9.7), China (4.5) and four others; India 7th |
Coal, coke and briquettes | <0.05 | 14.6 | -14.6 | <0.05 | 0.1 | -0.1 | Imp: Indonesia 49%, Russia 28% | Russia (13.3), Indonesia (10.5) and four others; India 7th |
All other products | 23.4 | 38.5 | -15.1 | 7.1 | 9.2 | -2.1 | Exp: UAE 28%, China 26% Imp: China 58%, Indonesia 11% | China (112.6), Brazil (93.0), Russia (24.0); India 4th |
Total | 95.9 | 339.4 | -243.4 | 22.0 | 49.1 | -27.1 |
|
|
Source: World Bank WITS (India-reported data, HS 4-digit, calendar year 2025); author’s computations. Members exporting more than India: each member’s 2025 exports of the sector to the other members, using partner-reported data where a member did not report; pharmaceutical ranking cited in the text: see footnote. Sectors by HS code: engineering 72-89 excluding electronics; electronics 8471, 8473, 8517-8529, 8532-8534, 8540-8542; chemicals 28-29; pharmaceuticals 30; fertilisers 31; textiles 50-63; gems and jewellery 71 excluding gold (7108); petroleum 2709-2715; coal 2701-2704; vegetable oils 1507-1518; marine 03, 1604-1605; rice 1006. <0.05: below $0.05 billion. Partner shares are of India’s sector trade with BRICS members. Totals match Tables 2 and 3.
Why these sectors. The sectors follow the Department of Commerce’s principal commodity groups and were chosen on three criteria: India’s largest export sectors; the import items that drive the deficit with the bloc (petroleum, electronics, gold, coal, fertilisers and vegetable oils); and sectors in which India earns a surplus or leads globally (rice, marine products and pharmaceuticals). Together they account for 76% of India’s exports to BRICS members and 89% of its imports from them in 2025, and 68% and 81% of its exports to and imports from the partner countries; the rest is shown as all other products.
5.1 INDIA'S STRONGEST SECTORS
- Engineering goods. India’s largest export to both BRICS members ($24.4 billion) and partner countries ($6.9 billion) in 2025. It includes machinery, vehicles and auto components, which the Government has identified as having untapped potential in Russia.
- Electronic goods. Exports to BRICS members reached $7.3 billion in 2025, two-thirds of them to the UAE, making India the third-largest exporter of electronics to the bloc after China and Saudi Arabia.
- Drugs and pharmaceuticals. A globally competitive sector, ranked 11th in the world by value and 3rd by volume; India supplies 55-60% of UNICEF’s vaccines. India is the largest exporter of pharmaceuticals to the bloc among members, yet its exports were only $2.6 billion to members and $1.5 billion to partner countries in 2025, and it holds just 0.2% of China’s pharmaceutical import market.
- Marine products and rice. Both earn surpluses with members and partner countries alike, and India is the largest exporter of rice to other BRICS members. Food and marine products are among the sectors India and the UAE have prioritised under the CEPA.
5.2 SECTORS THAT NEED TO BE STRENGTHENED
- Electronic components and capital goods. Imports of electronic and engineering goods from BRICS members come mainly from China, and India also runs an $8.3 billion electronics deficit with partner countries, mainly Vietnam and Malaysia. According to Government sources, most imports from China are intermediate and capital goods, such as pharmaceutical ingredients, auto components, electronic parts and machinery. Together they form the largest non-oil source of the deficit with China.
- Labour-intensive exports. Textile trade with members is almost balanced (exports of $5.0 billion against imports of $5.4 billion), and 96% of gems and jewellery exports to members go to the UAE alone. These MSME-dominated sectors stand to gain most from the Declaration’s provisions on MSME finance, customs and logistics.
- Chemicals and pharmaceutical inputs. The chemicals sector recorded a $15.8 billion deficit with BRICS members in 2025, with $13.1 billion of imports from China, while pharmaceuticals still depend on imported bulk drugs; the PLI scheme for 41 bulk drugs (₹6,940 crore) had 34 of 48 projects commissioned by December 2024.
- Energy, gold and agricultural commodities. Petroleum (mainly from Russia and the UAE), gold (mainly from the UAE), coal, fertilisers and vegetable oils made up $148.7 billion, or 44%, of India’s imports from BRICS members in 2025. They span energy and industrial inputs (petroleum and coal), a farm input (fertilisers), a consumer staple (edible oils) and a store of value (gold); together they call for diversified supply and greater domestic capacity rather than export promotion.
6. ADDRESSING INDIA'S TRADE IMBALANCES: COUNTRY-SPECIFIC ANALYSIS
The sectoral data show that India’s deficit stems from different drivers in different relationships: energy imports from Russia, the UAE and Saudi Arabia, manufactured inputs from China, and farm and mineral inputs from Indonesia. The gap continues to widen: according to an analysis of International Trade Centre data reported by Outlook Business, India’s deficit with BRICS members rose by 17.2% year on year to about $130 billion in January-June 2026. Because the drivers differ, so should the policy response: better export access may help in one market, while domestic production capacity or supply diversification matters more in another. The following analysis therefore examines the principal bilateral imbalances and assesses how the provisions of the New Delhi Declaration (see Annexure) could address each.
6.1 CHINA (2025 DEFICIT: $131.4 BILLION): MARKET ACCESS AND ELECTRONICS
6.1.1 Barriers to Indian export
- The imbalance: On 16 October 2026, the Government described China’s non-tariff barriers (rules other than import duties, such as plant-health and safety checks) as “the biggest hurdle” in bilateral trade. It stated that China restricts Indian generic medicines, bovine meat and vegetables. India holds only 0.2% of China’s pharmaceutical import market, estimated at $40.4 billion, and its pharmaceutical exports to China fell by 11.54% in FY26 to $287.42 million.
- Declaration link: As mentioned in the Declaration (Annexure: WTO & trade rules), members are concerned about rising tariffs and non-tariff barriers that distort trade, and seek to promote closer cooperation between medicine regulators on common quality standards. For India, non-tariff barriers are a significant constraint on exports to China, alongside competition and product composition.
- Policy options for addressing the imbalance: India can present China with a specific list of barriers, such as delays in approving medicines and farm products, and seek time-bound resolution of each. It can also negotiate with China for mutual recognition of relevant standards, so that inspections Indian plants have already passed are accepted. If faster approvals raised India’s share of China’s pharmaceutical imports from 0.2% to 2%, Indian exports to that market would be valued at around $0.8 billion a year, around $0.7 billion more than current figures; actual gains would depend on approvals, competition and supply capacity.
6.1.2 Dependence on Chinese electronics
- The imbalance: According to a study by Koan Advisory and the Institute of Chinese Studies, India’s deficit with China in electrical machinery and electronics (HS Chapter 85) reached $43.1 billion in FY26, compared with about $20 billion in FY19. China supplied at least 80% of India’s imports in 636 tariff lines in FY26, up from 461 in FY19.
- Declaration link: As mentioned in the Declaration (Annexure: GVC Action Plan 2026-30; SEZs & digital trade documents), members aim to move developing economies into higher-value stages of manufacturing, through a 2026-2030 action plan on cross-border production networks and the use of Special Economic Zones (SEZs). An economy that develops domestic component-manufacturing capacity reduces its import dependence and captures a greater share of domestic value added per unit of exports.
- Policy options for addressing the imbalance: The 636 tariff lines in which China supplies at least 80% of India’s imports already provide a list of high-dependence products. Not all of them suit SEZ-based manufacturing, but the electronic components among them, such as circuit boards, chips and batteries, are assembly-intensive and export-oriented, which makes them suitable. India can use the GVC Action Plan to prioritise this subset and attract investment in component manufacturing into Indian SEZs. This approach is already showing results: India’s exports of telephone parts to China rose by 498% to $2.32 billion in FY26, led by printed circuit boards.
6.1.3 Critical minerals
- The imbalance: China supplied 60-80% by value and 85-90% by volume of India’s imports of rare earth permanent magnets in 2022-25. The Government approved the National Critical Mineral Mission in January 2025 and a ₹7,280 crore scheme for domestic magnet manufacturing in November 2025.
- Declaration link: As mentioned in the Declaration (Annexure: Energy & critical minerals), members seek diversified and reliable supply chains for critical minerals. Reliance on a single supplier exposes Indian industry to price shocks and supply cuts.
- Policy options for addressing the imbalance: India can combine this commitment with its National Critical Mineral Mission to source and process minerals from Brazil, South Africa and Russia. Diversifying sources would reduce supply-chain risk; it would reduce import dependence and add domestic value only if extraction, processing and downstream manufacturing also develop in India, subject to cost, technology and commercial viability.
6.2 RUSSIA (2025 DEFICIT: $58.4 BILLION): LARGE OIL IMPORTS, SMALL EXPORTS
6.2.1 Crude oil
- The imbalance: The deficit with Russia widened after February 2022, when Russia began selling crude oil to India at a discount. Russia supplied about 36% of India’s crude oil imports in FY24 and FY25. In FY25, crude oil accounted for about $57 billion of India’s imports from Russia. India’s share of Russia’s imports is below 2%.
- Declaration link: As mentioned in the Declaration (Annexure: Energy & critical minerals), members commit to uninterrupted energy flows from diverse sources. This supports India’s energy security, but it does not change the pattern of trade: India imports large volumes of oil from Russia, while its exports to Russia remain limited.
- Policy options for addressing the imbalance: The deficit can narrow only through higher exports. The Government has identified automobiles, electronics, heavy machinery, textiles and food products as sectors with untapped export potential. These sectors should be central to India’s negotiations on the proposed trade agreement with the Eurasian Economic Union (see Section 6.2.3).
6.2.2 Payment in Rupees
- The imbalance: Trade in rupees has stalled because Russian exporters earn more rupees than they can spend in India. About $8 billion was reported to be held in special rupee accounts (vostro accounts) in Indian banks by 2023.
- Declaration link: As mentioned in the Declaration (Annexure: Cross-border payments), members will promote trade and investment settled in their own currencies. Local-currency settlement lowers conversion costs and reduces reliance on the US dollar, but it works only when both sides can spend the currency they earn.
- Policy options for addressing the imbalance: India can channel the surplus rupee balances into purchases of Indian goods and into investment in India; the Reserve Bank of India already allows surplus balances to be invested in government securities and projects. In this way, rupees earned from oil sales would flow back as demand for Indian goods and assets rather than accumulating as idle balances.
6.2.3 Customs and the Eurasian Economic Union agreement
- The imbalance: India and the Eurasian Economic Union (EAEU), a Russia-led trade bloc, signed Terms of Reference on 20 August 2025 to negotiate a free trade agreement. India’s trade with the EAEU was $69 billion in 2024. India and Russia also signed a mutual-recognition arrangement for trusted traders (Authorised Economic Operators) in May 2024.
- Declaration link: As mentioned in the Declaration (Annexure: Customs & AEO; MSMEs & export finance; Invoice discounting), members will work towards a customs cooperation agreement and mutual recognition of trusted traders, which reduces border delays and costs. The Declaration also supports easier credit for small exporters, including a study on invoice discounting, which allows exporters to be paid early against their bills.
- Policy options for addressing the imbalance: India can use its existing trusted-trader arrangement with Russia to speed up customs clearance for Indian medicines, food and engineering goods. If the proposed agreement lowers tariffs and generates new orders from Russia, easier export finance would help small firms fulfil them; India and Russia aim to raise bilateral trade to $100 billion by 2030.
6.3 UAE (2025 DEFICIT: $17.1 BILLION): PREFERENTIAL ACCESS IN PLACE, DEFICIT DRIVEN BY OIL
6.3.1 Trade agreement and local-currency payments
- The imbalance: Large crude oil imports drive the deficit, despite the free trade agreement between the two countries. Under the India-UAE Comprehensive Economic Partnership Agreement (CEPA), India’s non-oil exports to the UAE reached $27.4 billion in FY24, growing by 25.6% a year on average. Both countries aim to reach $100 billion in non-oil, non-precious-metal trade by 2030.
- Declaration link: As mentioned in the Declaration (Annexure: Cross-border payments), members will promote settlement in local currencies. This builds on the July 2023 agreements between the Reserve Bank of India and the Central Bank of the UAE, which allow trade to be invoiced in rupees and dirhams and link India’s UPI with the UAE’s payment platform.
- Policy options for addressing the imbalance: India can invoice a larger share of oil and non-oil trade in rupees and dirhams. This would lower currency-conversion costs and reliance on dollar-based settlement, but would not reduce the import bill or the deficit. The deficit itself can narrow only through continued export growth under CEPA.
6.3.2 Diamonds and precious metals
- The imbalance: Gems and jewellery are among the fastest-growing Indian exports to the UAE.
- Declaration link: As mentioned in the Declaration (Annexure: Diamonds & precious metals), members support the Kimberley Process, the international certification scheme for rough diamonds, and will explore ways to promote trade in diamonds and precious metals.
- Policy options for addressing the imbalance: India can strengthen domestic value addition by importing rough diamonds and expanding exports of cut-and-polished stones and jewellery. The gains would depend on the extent of domestic processing, employment and the value retained within India’s production chain.
6.4 INDONESIA (2025 DEFICIT: $16.9 BILLION): EDIBLE OIL AND COAL
6.4.1 Vegetable oils
- The imbalance: Coal and palm oil make up most of India’s imports from Indonesia, which is India’s largest supplier of palm oil. The bilateral deficit narrowed from $18.8 billion in FY23 to $17.4 billion in FY25, as imports fell from $28.8 billion to $22.8 billion. India imported about 16 million tonnes of edible oil in the 2024-25 oil year (November-October), and imports meet more than half of its domestic demand.
- Declaration link: As mentioned in the Declaration (Annexure: Agricultural trade; Agriculture & Grain Exchange), members seek fair market access in vegetable oils and support a BRICS Grain Exchange to expand farm trade among members. Steadier supply and prices would reduce India’s exposure to price shocks.
- Policy options for addressing the imbalance: First, India can import less: the National Mission on Edible Oils aims to raise domestic production to 25.45 million tonnes by 2030-31, meeting about 72% of demand. Second, it can use the Grain Exchange to sell more farm products in BRICS markets. Third, it can use the review of the ASEAN-India goods agreement, which covers market access and rules of origin, to secure better access for Indian goods in Indonesia.
6.5 BRAZIL AND SOUTH AFRICA (SMALL DEFICITS): SCOPE TO RAISE EXPORTS
6.5.1 Expanding the India-Mercosur agreement
- The imbalance: India’s deficits with Brazil (about $0.8 billion) and South Africa (about $1.5 billion) were small in 2025, but trade remains limited, and exports to both countries fell between 2022 and 2025. India’s preferential trade agreement with Mercosur covers only about 450 product categories. The Brazilian Government has described it as “too limited”, and both sides have agreed the terms for wider negotiations.
- Declaration link: As mentioned in the Declaration (Annexure: GVC Action Plan 2026-30; Transport & logistics), members will take steps to raise trade among themselves and have set up a framework for logistics and supply-chain cooperation. Lower shipping time and cost matter most on long routes, such as those to Brazil and South Africa.
- Policy options for addressing the imbalance: India can seek to include medicines, auto components and engineering goods in the expanded agreement, and use the logistics framework to cut shipping time and cost to Brazil and South Africa. Although these markets are too small to close the overall deficit on their own, higher exports to them would help narrow it, and they offer scope for export growth without a large rise in imports.
6.6 ACROSS ALL PARTNERS: MAKING THE DECLARATION MEASURABLE
6.6.1 Targets the Declaration does not set
- The gap: The Declaration sets no numerical target for trade or for reducing deficits. In 2025, India’s exports to BRICS members covered only 28.3% of its imports from them (Table 1); on fiscal-year data, BRICS supplied about 42% of India’s imports but took only about 22% of its exports in FY26 (April 2025-March 2026).
- Policy options for addressing the imbalance: At the next meeting of BRICS nations, India can propose the following: (a) an annual report on trade imbalances and non-tariff barriers; (b) firm start dates for invoice discounting and digital trade documents; and (c) a yearly review of the GVC Action Plan, using indicators such as the export-import coverage ratio and import concentration.
7. THE ROLE OF PREFERENTIAL TRADE AGREEMENTS IN INDIA'S TRADE WITHIN THE BRICS FRAMEWORK
India’s existing trade agreements with BRICS members provide a foundation for improving market access, but their contribution to balancing trade varies across partners. For instance, in the case of the India-UAE CEPA (in force since May 2022), India’s exports to the UAE grew faster than its imports between 2022 and 2025 (Table 2), consistent with improved export performance under preferential access, although other factors may also have contributed. The India-Mercosur PTA and the ASEAN-India Trade in Goods Agreement, by contrast, provide tariff concessions through product-specific and regional arrangements. India and China also participate in the Asia-Pacific Trade Agreement, while the Global System of Trade Preferences provides a broader framework for trade concessions among participating developing economies.
However, these agreements do not automatically reduce India’s trade deficits. Their effectiveness depends on the extent of tariff preferences, the competitiveness of Indian products, compliance with rules of origin, and domestic firms’ ability to expand exports. India’s priority should therefore be to make better use of existing preferences, address non-tariff barriers and strengthen domestic value addition. Future agreements and negotiations should be assessed not simply by the number of tariff concessions secured, but by their potential to diversify exports, improve market access and strengthen India’s position in regional and global value chains.
8 CONCLUSION
The analysis indicates that India’s trade deficit with BRICS nations is concentrated in energy and manufactured goods imports, particularly those sourced from Russia and China. The New Delhi Declaration provides a framework for addressing some of the constraints affecting India’s export performance through improved market access, customs cooperation, MSME finance, digital trade facilitation, and participation in higher-value global value chains. However, these commitments will not automatically narrow the trade deficit. Their effectiveness will depend on implementation, domestic manufacturing capabilities, export competitiveness, and the extent to which Indian firms can access and serve partner-country markets.
The success of India’s BRICS chairship should therefore be assessed not only by the expansion of intra-BRICS trade, but also by the quality of that integration. Relevant indicators include export growth, diversification, domestic value addition, import concentration, and MSME participation in international trade. The central test is whether the Declaration’s commitments translate into measurable improvements in India’s capacity to produce and export higher-value goods, rather than remaining broad statements of intent.
9. ANNEXURE
Table A1: Provisions of the New Delhi Declaration referred to in this article
Sections | What the Declaration says | Implications |
WTO & trade rules | BRICS backed WTO reform, restoration of the two-tier dispute-settlement system and opposed rising tariffs, non-tariff barriers and protectionism. | For trade: A more predictable WTO system could reduce policy uncertainty for exporters. The pushback against tariffs and non-tariff barriers is particularly relevant as protectionism raises the cost of accessing major markets. |
Agriculture & Grain Exchange | Continued work on a BRICS Grain Exchange, with scope to expand it to other agricultural commodities; greater intra-BRICS trade in agricultural products and inputs was also encouraged. | For food trade: A common trading platform could improve market coordination and supply security, particularly during price or supply shocks. For India, it could also create a more structured channel for agricultural sourcing and exports. |
Agricultural trade | BRICS backed a fair, balanced and development-oriented agricultural trading system and specifically referred to the sustainable vegetable oils sector. | For India: The vegetable-oil reference is commercially relevant given India’s dependence on edible-oil imports. Greater coordination could improve supply resilience, although the Declaration does not create preferential market access. |
Energy & critical minerals | BRICS called for stable energy markets, uninterrupted flows and resilient, diversified critical-mineral supply chains. | For industry: More diversified mineral and energy supply chains can reduce concentration risks for sectors such as EVs, electronics, renewables and advanced manufacturing. The economic benefit will depend on whether cooperation moves beyond supply-security statements into investment and processing capacity. |
Manufacturing & Industry 4.0 | BRICS linked industrialisation with increasing manufacturing exports, MSME market access, technology transfer and productivity; cooperation covers photovoltaics, intelligent manufacturing, robotics and chemicals. | For exports: This shifts the agenda from simply expanding trade to building exportable industrial capacity. For India, cooperation in manufacturing technologies and solar PV could support higher-value participation in global production networks. |
Diamonds & precious metals | BRICS supported the Kimberley Process, welcomed India’s chairship and will examine mechanisms to promote trade in diamonds and precious metals. | For Indian commerce: This is one of the most sector-specific opportunities in the Declaration. Better cooperation could support India’s diamond-cutting, jewellery and precious-metals trade, particularly with African producers. |
Higher-value GVCs | BRICS wants developing economies to participate more broadly in higher-value-added segments of manufacturing and production through trade, investment, technology transfer and technical cooperation. | For growth: This is potentially more important than simply increasing trade volumes. Moving into higher-value activities means greater domestic value addition, productivity and export earnings rather than remaining concentrated in lower-value stages of production. |
GVC Action Plan 2026-30 | BRICS will develop a GVC Action Plan 2026-2030, including measures to enhance intra-BRICS trade and help EMDCs move up the value chain. | For trade integration: This provides a medium-term framework for deeper production linkages. The key economic test will be whether it translates into actual cross-border sourcing and investment rather than remaining a coordination exercise. |
MSMEs & export finance | BRICS introduced guiding principles for credit assessment of export-oriented MSMEs and backed digital/platform-based trade-finance solutions. | For exporters: Easier access to working capital could bring more smaller firms into international trade. This matters because finance constraints can prevent otherwise competitive MSMEs from taking export orders. |
Invoice discounting | The Jaipur Consensus will study an Invoice Discounting Mechanism for BRICS members to unlock MSME working capital. | For trade finance: This could shorten the working-capital cycle for exporters by allowing receivables to be monetised earlier. Its impact, however, depends on whether the proposed mechanism eventually becomes operational across members. |
SEZs & digital trade documents | BRICS wants SEZs to support trade, investment and GVC integration and proposes cooperation on digitisation of trade documentation. | For trade costs: Digitised documentation and streamlined SEZ procedures can reduce paperwork, processing time and administrative friction. The Declaration, however, recognises differences in members’ implementation capacity. |
Customs & AEO | BRICS is advancing a customs cooperation agreement and a voluntary AEO Action Plan 2026, including information exchange, capacity building and mutual recognition. | For logistics: Mutual recognition of trusted traders could reduce border delays and make compliant shipments more predictable. This is one of the provisions with a potentially direct impact on trade transaction costs. |
Cross-border payments | BRICS is studying interoperability of payment and messaging systems and promoting trade settlement and investment in local currencies. | For businesses: More interoperable payment systems could reduce transaction costs and settlement friction. Local-currency settlement could also reduce some exposure to currency conversion and payment bottlenecks, although the Declaration explicitly avoids a one-size-fits-all model. |
New Investment Platform | BRICS is continuing technical work on a phased, consensus-based New Investment Platform, with a dedicated Study Group under consideration. | For investment: The potential is significant if the platform eventually channels capital into cross-border projects. But there is no operational platform, corpus or investment target yet, so the near-term economic impact is limited. |
PPPs & de-risking | BRICS welcomed work on PPP models and de-risking mechanisms for infrastructure investment. | For infrastructure: Better risk allocation can make projects more bankable and attract private capital. This is particularly relevant to connectivity infrastructure needed to support greater intra-BRICS trade. |
Insurance & Risk Lab | BRICS proposed a voluntary Insurance Resilience Centre and supported India’s proposal for a BRICS Risk Lab at GIFT City IFSC. | For investment: Better insurance and reinsurance capacity can lower perceived risk on cross-border projects. For India, the GIFT City proposal also strengthens its positioning as a regional financial-services hub. |
Transport & logistics | BRICS established a Logistics Supply-Chain Cooperation Framework and encouraged discussion on a Railway Research Network, alongside cooperation on transport investment and technology. | For trade: Better transport connectivity is the physical counterpart to trade facilitation. If implemented, stronger logistics links could lower delivery times and costs and make intra-BRICS supply chains more viable. |
Economic Partnership 2030 | The Strategy for BRICS Economic Partnership remains the overarching framework, with India credited for advancing the 2030 strategy. | For investors and businesses: This gives the numerous sectoral initiatives a longer-term policy framework. Its significance will depend on converting broad cooperation into implementable national and cross-border measures. |
Growth & Development Task Force | India’s chairship established a BRICS Task Force on Growth and Development, covering development finance, digital transformation, AI and climate finance. | For growth: Growth is now an explicit institutional workstream. However, there is no numerical GDP, trade or investment target, making this more of a policy-coordination mechanism than a quantified growth commitment. |
Multilateral guarantees | The Declaration records progress on BRICS Multilateral Guarantees to mobilise private capital and reduce financing costs, with technical work and pilot transactions encouraged. | For investment: Guarantees can help crowd in private capital by reducing project risk. The economic impact will depend on whether the proposed pilots develop into a scalable financing mechanism. |
Source: BRICS New Delhi Declaration.
10 REFERENCES
- https://infobrics.org/files/country/russia/documents/2026/declaration/2026_09_12_New_Delhi_Declaration_VIII_Sammit_BRICS.pdf
- Caixin Global, “High-tech engine powers China’s trade to new heights”, 16 January 2026 (citing China customs data). https://www.caixinglobal.com/2026-01-16/high-tech-engine-powers-chinas-trade-to-new-heights-102404238.html
- China Briefing (Dezan Shira & Associates), “China’s Import-Export in 2025: Full-Year Data, Trends, and 2026 Outlook”, 2026. https://www.china-briefing.com/news/chinas-import-export-2025/
- Gaidar Institute for Economic Policy, “Outcomes of Russia’s foreign trade in 2025”, 2 March 2026. https://www.iep.ru/en/monitoring/outcomes-of-russia-s-foreign-trade-in-2025.html
- Forbes Brasil, “Brasil tem superávit comercial de US$ 68,3 bi em 2025”, 6 January 2026 (citing Ministry of Development, Industry, Trade and Services data). https://forbes.com.br/forbes-money/2026/01/brasil-tem-superavit-comercial-de-us-683-bi-em-2025/
- DatamarNews, “Brazil’s trade surplus leans more heavily on oil exports”, 2026 (citing Ibre-FGV Icomex, based on Secex/MDIC data). https://datamarnews.com/noticias/brazils-trade-surplus-leans-more-heavily-on-oil-exports/
- World Bank, World Integrated Trade Solution (WITS), India’s merchandise trade with BRICS members and partner countries, 2022–2025 (gross exports and imports, calendar years, US$ thousand); author’s data extract. https://wits.worldbank.org/
- The Economic Times, “India-BRICS trade increased more than 100% during last five years to USD 417 billion in 2025-26: ASSOCHAM”, 2026. https://economictimes.indiatimes.com/news/economy/foreign-trade/india-brics-trade-increased-more-than-100-during-last-five-years-to-usd-417-billion-in-2025-26-assocham/articleshow/134069496.cms
- Global rankings: PIB, “India’s Pharmaceuticals in Global Healthcare”, 21 March 2026.
- Press Information Bureau, Government of India, “A Dose of Atmanirbhar Bharat” (Department of Pharmaceuticals), 13 April 2025. https://static.pib.gov.in/WriteReadData/specificdocs/documents/2025/apr/doc2025413539601.pdf
- Press Information Bureau, Ministry of Commerce and Industry, “India and UAE review CEPA progress; set sights on USD 100 billion non-oil trade by 2030”, 1 September 2025. https://www.commerce.gov.in/files/d-m-y/Press%20Release_Press%20Information%20Bureau_0.pdf
- Ministry of Commerce and Industry, Government of India, reply to Lok Sabha Unstarred Question No. 4023, 25 March 2025. https://www.commerce.gov.in/wp-content/uploads/2025/03/LS-USQ-No.4023-dated.-25.03.2025.pdf
- Outlook Business, “India’s BRICS Trade Surges, But So Does Its $130 Bn Deficit”, 11 September 2026. https://www.outlookbusiness.com/news/indias-brics-trade-surges-but-so-does-its-130-bn-deficit
- Prime Minister’s Office, Government of India, “BRICS New Delhi Declaration: Building for Resilience, Innovation, Cooperation and Sustainability”, 12 September 2026. https://www.pmindia.gov.in/en/news_updates/brics-new-delhi-declaration-building-for-resilience-innovation-cooperation-and-sustainability-september-12-2026/
- ThePrint, report on trade barriers in India-China trade, 16 October 2026. https://theprint.in/economy/finance-minister-sitharaman-says-trade-barriers-the-biggest-hurdle-in-india-china-ties/3073497/
- Policy Circle, “China’s non-tariff barriers expose limits of India’s FTA push”, 19 October 2026 (citing NITI Aayog Trade Watch). https://www.policycircle.org/economy/chinas-non-tariff-barriers-india-fta/
- ThePrint, “India’s China trade deficit is now structural; electronics goods deficit doubled to $43 bn since 2019”, 17 September 2026. https://theprint.in/diplomacy/indias-china-trade-deficit-is-now-structural-electronics-goods-deficit-doubled-to-43-bn-since-2019/3045270/
- Press Information Bureau, Government of India, “India’s Rare Earth Strategy: Manufacturing, Corridors, and Global Integration”, 2 February 2026. https://static.pib.gov.in/WriteReadData/specificdocs/documents/2026/feb/doc202622776601.pdf
- Business Standard, “India-Brics trade is essentially an import story as deficit widens”, 8 September 2026. https://www.business-standard.com/economy/news/india-brics-trade-is-essentially-an-import-story-as-deficit-widens-126090801309_1.html
- Swarajya, “India to push reworking the ASEAN free trade pact as trade deficit crosses $45 billion: report”, July 2026. https://swarajyamag.com/news-brief/india-to-push-reworking-the-asean-free-trade-pact-as-trade-deficit-crosses-rs-45-billion-report
- Business Today, “Centre lifts ban on non-basmati white rice exports, boosting agricultural sector”, 28 September 2024. https://www.businesstoday.in/industry/agriculture/story/centre-lifts-ban-on-non-basmati-white-rice-exports-boosting-agricultural-sector-447899-2024-09-28
- The Tribune, “India’s crude import costs rise as Russian share dips amid pressure to reduce imports: Report”, 23 October 2025 (citing Commerce Ministry data). https://www.tribuneindia.com/news/business/indias-crude-import-costs-rise-as-russian-share-dips-amid-pressure-to-reduce-imports-report
- IANS, report on balancing India-Russia trade, 4 December 2025. https://ianslive.in/india-must-boost-exports-to-russia-to-balance-trade-basket-piyush-goyal–20251204174504
- Outlook Business, “Russian Exporters Holding $8 Billion In Indian Vostro Accounts”, 19 October 2023. https://www.outlookbusiness.com/news/russian-exporters-holding-8-billion-in-indian-vostro-accounts
- Press Information Bureau / Department of Commerce, Government of India, release on the signing of Terms of Reference for the India–EAEU FTA, 20 August 2025. https://www.commerce.gov.in/files/d-m-y/PIB2158480.pdf
- Business Standard, “Govt pursuing customs mutual recognition agreements with nations: CBIC”, 22 May 2024. https://www.business-standard.com/india-news/govt-pursuing-customs-mutual-recognition-agreements-with-nations-cbic-124052200730_1.html
- Arab News, “India, UAE review CEPA progress, target $100bn in non-oil trade”, 2 September 2025 (citing India’s Ministry of Commerce and Industry). https://www.arabnews.com/node/2613879/world
- Reserve Bank of India, press release on MoUs with the Central Bank of the UAE on local-currency settlement and payment-system linkage, 15 July 2023. https://rbi.org.in/Scripts/BS_PressReleaseDisplay.aspx?prid=56054
- Consulate General of India, Medan, “India-Indonesia Economic & Commercial Relations” (bilateral trade data for FY2022-23 to FY2024-25), 2025. https://www.cgimedan.gov.in/docs/1749813529ECONOMIC%20&%20COMMERCIAL%20RELATIONS.pdf
- Outlook Business (PTI), “Edible Oil imports Up 22% to ₹1.61 lakh Cr In 2024-25 Mkt yr; Volume Flat: SEA”, 14 November 2025. https://www.outlookbusiness.com/markets/edible-oil-imports-up-22-to-161-lakh-cr-in-2024-25-mkt-yr-volume-flat-sea
- Press Information Bureau, Government of India, backgrounder “National Mission on Edible Oils”, December 2025. https://static.pib.gov.in/WriteReadData/specificdocs/documents/2025/dec/doc2025128722301.pdf
- Outlook Business (PTI), “Next round of talks for India-Asean trade pact review in July”, 12 May 2024. https://www.outlookbusiness.com/economy-and-policy/next-round-of-talks-for-india-asean-trade-pact-review-in-july
- News On AIR (Prasar Bharati), “Brazil, India move to widen Mercosur trade pact”, 1 October 2026. https://newsonair.gov.in/brazil-india-move-to-widen-mercosur-trade-pact/