
The India-UK FTA at Entry into Force
Manya Kakkar
Research Assistant
1. INTRODUCTION
On the morning of 15 July 2026, the first export consignments under India-United Kingdom Comprehensive Economic and Trade Agreement (CETA) were flagged off at the Inland Container Depot in Sanand, Ahmedabad. They were worth over USD 319,000 and included industrial equipment, pharmaceuticals, automobiles, polymers and textiles from seven regional exporters.
The symbolism was deliberate. Gujarat, the state that embodies India’s manufacturing ambition, would send the first shipment under a deal that took over three years and fourteen formal rounds to finalise.
But the real story of CETA will not be written in those ceremonial containers. It will be written in the months and years ahead, in the compliance paperwork of a textile exporter in Tirupur, in the certification costs of a leather manufacturer in Agra, in the utilisation rates that determine whether this agreement becomes a genuine structural opening or just a marginal adjustment dressed up as a breakthrough.
CETA is India’s first major FTA with a G7 economy. For the UK, it is the most significant bilateral trade deal since Brexit.
This briefing does not summarise the agreement chapter by chapter. Instead, it asks: what actually changes on the ground, for whom, and on what timeline?
In short
- India’s trade with the UK grew from USD 21.7 billion in 2015 to USD 56.4 billion in 2024, nearly tripling in under a decade.
- The UK drops duties on 99% of Indian goods immediately. India moves slower: only 64% of its tariff lines are duty-free from day one.
- Both governments want to double trade to USD 120 billion by 2030.
- Indian exporters currently claim the tariff benefits on only 20-30% of eligible exports under existing FTAs, well below the 60-70% claimed by exporters selling into India. That gap is the real risk to this deal delivering on its promise.
TWO DECADES IN THE MAKING
India’s trade with Britain has grown steadily for years, well before any tariff cut was on the table. It went from roughly USD 21.7 billion in 2015 to USD 56.4 billion in 2024, almost tripling in under a decade.
The most recent numbers are a bit more uneven. According to India’s Commerce Ministry data, overall bilateral trade was up 8.6% in FY2025-26, whereas India’s exports to the UK actually fell 7.6%, even as India’s imports from the UK jumped 36%. In other words, the UK is selling more to India than India is selling to the UK right now. Whatever CETA does going forward, it inherits an export side that was already losing steam.
Getting here wasn’t quick. The two countries agreed to work toward a deal back in 2021, launched formal talks in January 2022, and then spent three years arguing over the details.
When | What happened |
May 2021 | Prime Ministers Narendra Modi and Boris Johnson agree to work toward a full trade deal |
Jan 2022 | Formal negotiations begin |
Jan-May 2024 | Talks stall over EV tariffs, whisky, and social security; paused for India’s election |
May 2025 | Agreement in principle, after the UK’s own change of government |
24 July 2025 | CETA signed in London |
15 July 2026 | Enters into force |
Author’s compilation from UK Parliament and Ministry of Commerce and Industry records
WHAT EACH SIDE ACTUALLY SELLS THE OTHER
India is still a small trading partner for UK, only around 2.5% of total UK trade, which is exactly the gap this deal is meant to close. The two trade baskets barely overlap. The UK sends India machinery, precious stones, spirits, and car parts, categories India used to tax heavily (farm goods averaged 36.7% duty, cars and transport equipment over 20%). India sends the UK telecom equipment, refined fuel, generic medicines, and clothing, categories where UK duties were lower but still real: up to 21.5% on marine products, up to 16% on leather.
UK sells India mostly | India sells the UK mostly |
Precious and semi-precious stones | Telecom equipment |
Machinery and boilers | Refined petroleum |
Electrical equipment | Pharmaceuticals |
Scotch whisky and spirits | Apparel and textiles |
Author’s compilation from IBEF and UK Department for Business and Trade, FY26.
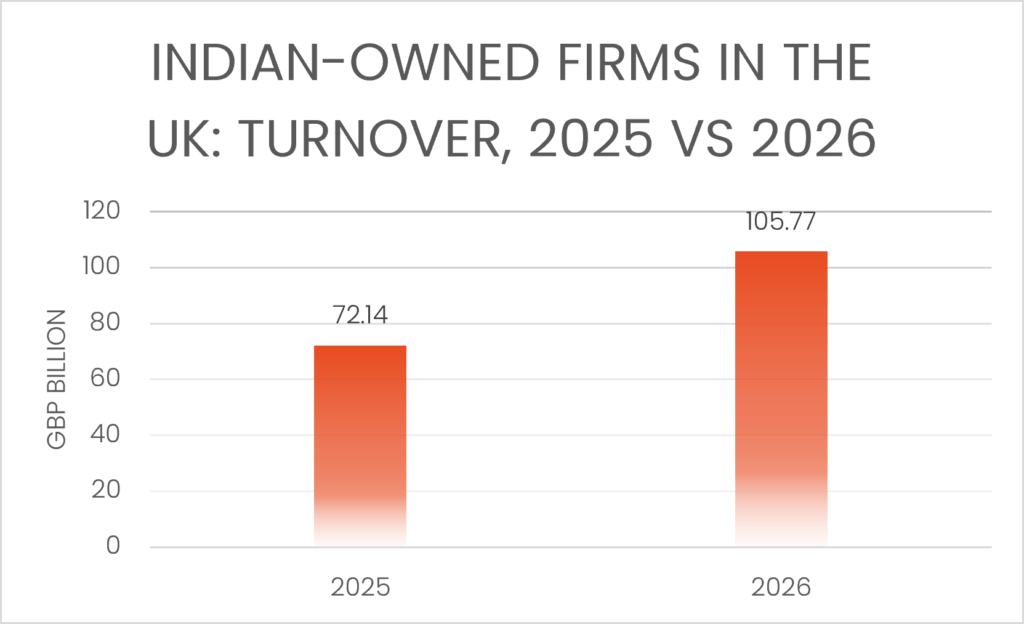
There’s already real money flowing between the two countries. The UK is India’s sixth-largest source of foreign investment. Going the other way, Indian-owned firms in Britain now number 1,912, up almost 60% in 2026, with combined turnover past USD 143 billion and over 200,000 people employed. Jaguar Land Rover, owned by Tata, is still Britain’s largest Indian-owned employer. The point is that CETA isn’t creating this relationship from nothing. It’s mostly locking in and de-risking something that was already growing.
What India exports to the UK is more spread out across categories. What India imports from the UK is more concentrated, led by pearls and precious stones alone at 34.7%. Both sides use the same period and the same source, so they are directly comparable.
India’s exports to UK
India’s imports from UK
Source: IBEF (India Brand Equity Foundation), India-UK Trade Relations overview, FY26 data (April-November 2025).
INSIDE THE DEAL
Strip away the legal language and CETA comes down to a few practical changes.
On tariffs: India moves in stages. Only 64% of its tariff lines are duty-free immediately, covering about 18% of what the UK actually exports to India by value. Another 24% of lines phase down to zero over the next ten years. About 12% stay protected altogether, mainly dairy, cereals, gold, and smartphones. India’s average tariff on UK goods drops from 15% to 3%. Britain’s side is simpler: it drops duties on 99% of Indian goods right away.
On paperwork: Most goods need to show 40-45% local content to qualify for the lower tariffs, and exporters can self-certify origin but have to keep records for five years in case of an audit. Both sides have promised faster customs, perishables cleared within six hours, most other goods within 48. There’s also a dedicated chapter for small exporters, unusual for an Indian trade deal.
On people and services: Professionals get new, defined routes into the UK, up to 20,000 service-supplier visas a year, plus 3,000 for graduates and a small quota for chefs and yoga instructors. Visa processing is capped at three weeks by the UK, four by India. Alongside CETA, a separate social security agreement exempts roughly 75,000 Indian workers in the UK from British National Insurance contributions for up to three years, a long-standing Indian ask that nearly sank the talks in 2024.
WHO ACTUALLY GAINS
Tariff schedules tell you who wins, and it’s not a one-way street the way most headlines suggest.
Sector | Before CETA | After CETA | Gains most |
Textiles and leather | UK duty up to 16% | Zero, day one | India |
Marine products | UK duty up to 21.5% | Zero, day one | India |
Gems and jewellery | UK duty applied | Zero; exports could triple to USD 2.5 bn | India |
Engineering goods | UK duty up to 18% | Zero, day one | India |
Scotch whisky | India duty 150% | 75% now, 40% by year 10 | UK |
Cars (petrol/diesel) | India duty up to 110% | Phased down to 10% over 10 years | UK |
Electric vehicles | India duty up to 110% | Same glide path, but starts only from year 6 | India, for now |
Silver | High Indian duty | Phased to zero over 10 years | UK |
Steel | USD ~900 mn in exports | Hit by new UK safeguards from July 2026 | UK, near term |
Author’s compilation from the Ministry of Commerce and Industry, UK DBT, GJEPC and GTRI.
Two observations stand out. Silver and premium spirits are clear gains for UK exporters rather than Indian ones. Steel, meanwhile, highlights the two-way nature of the agreement, with India’s export opportunities emerging alongside pressures on the UK side.

VERTICAL EXPANSION: CAN TRADE REALLY DOUBLE BY 2030
Both governments have their hopes on one number: doubling trade to USD 120 billion by 2030, from a 2024 base of around USD 56 billion. Doing the math, that needs roughly 13% growth a year, every year, for six years straight. That’s ambitious. The UK’s own imports from India grew about 11% a year between 2017 and 2024, without any tariff cuts at all. So the target does require CETA to meaningfully outdo what was already happening.
HORIZONTAL EXPANSION: NEW SECTORS, NEW STATES
The more interesting shift may not be how much more India and the UK trade, but what and where. UK import data already shows the mix moving away from the old staples, telecom equipment, refined fuel, pharma, toward semi-finished steel, engineering goods and optical fibre, categories that barely featured in the relationship a decade ago.
Geographically, the sectors CETA touches map onto specific manufacturing belts rather than the economy as a whole: Tirupur, Surat and Ludhiana for textiles, Agra and Kanpur for leather, Moradabad for handicrafts, and the coastal stretch from Kerala to Odisha for marine exports.
THE REAL RISK ISN'T THE TARIFFS
Tariff cuts make headlines, but for most exporters the real cost of trading under CETA comes down to paperwork. Proving origin, keeping five years of records, meeting a 40-45% local content threshold: manageable for a large firm with a compliance team, much harder for a mid-sized textile or leather exporter doing it for the first time.
This isn’t a small worry. According to the Global Trade Research Initiative, Indian exporters currently claim preferential tariffs on only 20-30% of the exports that already qualify under India’s existing trade deals, against 60-70% claimed by exporters selling into India. In plain terms: India signs trade deals and then leaves much of the benefit on the table, because the compliance cost of claiming it isn’t worth it for many exporters. Whether CETA breaks that pattern or repeats it will say more about whether this deal works than anything in the treaty text.
There’s a second, more specific cause coming for one sector. India’s steel exporters face a tightened UK safeguard regime from July 2026, and then the UK’s own carbon border tax from January 2027, which will apply a carbon price to steel, aluminium, and cement imports. Exporters in these categories are effectively getting hit from two directions just as CETA is meant to be helping them.
A TWO-SIDED DEAL, AND WHAT COMES NEXT
It’s tempting to read CETA as India winning and Britain conceding, and the tariff-line count (99% UK elimination versus roughly 90% Indian coverage) makes that easy to believe. But a fair reading gives Britain real wins too: guaranteed access to India’s silver and whisky markets, a defined path into India’s car market, expanded mobility for UK professionals, and, for the first time, a foot in India’s government procurement market. The UK’s own parliamentary committee called it a significant achievement while noting its benefits are backloaded: most of the estimated £25.5 billion in added annual trade, and the bulk of UK exporter savings, arrive only once India’s ten-year tariff schedule fully plays out.
So what should businesses and policymakers actually watch? Three things. Whether Indian MSMEs get real help navigating origin certification, not just awareness campaigns, since that’s the actual bottleneck. Whether steel and cement exporters start preparing for the UK’s carbon border tax now rather than in 2027. And whether either government starts publishing exporter-level utilisation data early, so the gap between what CETA promises and what exporters actually claim doesn’t stay hidden until it’s too late to fix.
The next eighteen months, covering steel’s collision with UK safeguards, the first mobility-visa applicants, and the first utilisation numbers, will say more about whether this deal hits its USD 120 billion target than anything written into the agreement itself.
SOURCES
Ministry of Commerce and Industry; DGFT; RBI; UK Department for Business and Trade; UK ONS; UK Parliament and House of Commons Library; WTO; UN Comtrade/WITS; World Bank; IMF; Global Trade Research Initiative (FTA Report Card 2026); GJEPC; Grant Thornton UK and CII (India Meets Britain Tracker 2026); KPMG; IBEF.