India US Tariff War
Sagnik Samadder|
Senior Research Associate
Tariffs and Trust: Why the U.S.-India Trade Rift Threatens a Strategic Partnership
In late August 2025, the United States took a sharp turn in its economic engagement with India, raising tariffs on Indian imports to as high as 50%[1]. The measure instantly doubled duties on a wide range of goods, from textiles and leather to machinery and gems. It was a move that stunned policymakers and traders alike, marking the steepest escalation in U.S.-India trade tensions in over a decade.
Washington framed the decision as a response to India’s “unfair trade practices” and its continued purchases of discounted Russian oil. New Delhi, however, saw it differently: as an act of economic aggression against a strategic partner. The result is a rapidly widening rift between two democracies that only recently promised to build the world’s most consequential partnership.
Till 2024, the scenario was quite different:
Product category | India tariff on US goods (MFN avg)[1] | US tariff on Indian goods (MFN avg)[2] | Analysis |
Agricultural products (overall)
Agricultural products (all food, fish, dairy, etc.) | 36.7% | India’s agri tariffs are among the highest globally; US agri tariffs are low on average but with some very high peaks (esp. dairy, sugar). | |
Electrical machinery & equipment
Electrical machinery and electronic equipment | Covers HS 85-type products (motors, transformers, electronics, etc.). | ||
Locomotives, aircraft & ships
Transport equipment (vehicles, aircraft, vessels, rail) | Includes motor vehicles as well as aircraft, ships and rolling stock. India’s protection here is much higher. | ||
Textiles (not clothing) Textiles (separate from clothing) | |||
Pharma
Chemicals (includes organic, inorganic chemicals & many pharmaceuticals) | |||
Precious stones
Minerals and metals (includes precious metals/stones; many HS 71 lines are 0%) | |||
Fish and aquatic products
Fish and fish products | India treats fish more like a sensitive food product; US fish tariffs are very low on average. | ||
Dairy products | |||
Plastic materials
Chemicals + Rubber, leather & footwear | Plastics (HS 39) sit between chemicals and rubber in classification, so I’ve given a range rather than a single point. | ||
Organic & inorganic materials
Chemicals (organic & inorganic chemicals, etc.) |
[1] WTO Tariffs of India on USA
A sudden shift in trade dynamics:
One must consider the broader trajectory of U.S.-India relations to understand the shockwaves this decision sent. Over the past decade, the two nations have deepened defence cooperation, aligned on Indo-Pacific strategy, and sought to reduce global dependence on Chinese manufacturing. Yet, on the trade front, friction has never truly disappeared.
India lost its Generalised System of Preferences (GSP)[1] benefits under the Trump administration in 2019, and despite high-level assurances, they were never reinstated. Now, with the second Trump administration in power, Washington’s renewed tariff push suggests that trade protectionism has re-emerged as a defining feature of U.S. policy.
[1] https://economictimes.indiatimes.com/news/economy/foreign-trade/despite-revoking-gsp-status-in-trump-1-0-india-us-trade-surged-trump-2-0-could-continue-the-trend-sbi/articleshow/115199197.cms?from=mdr
The table below provides an example of the various sectors in which India majorly excelled in exports in 2024 (values are showcased in billion USD).
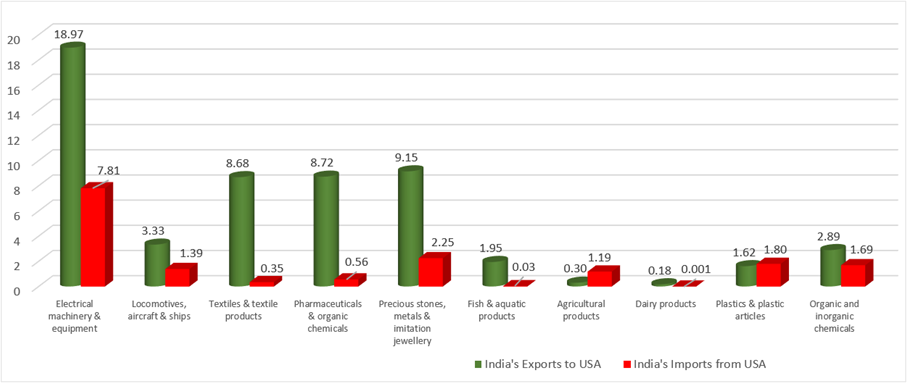
India’s exports far exceed imports from the USA in the pre-tariff year (2024), indicating India’s strong electronics and components export base, possibly including telecom parts, electrical components.
BRIEF compilation from WITS Database semiconductor assemblies, pharmaceuticals, textiles and other items. India exports more in this category, likely from sectors such as aerospace parts and ship components. The USA’s exports include high-tech aerospace machinery, but India still maintains a positive balance here. India is a net exporter, supplying garments, fabrics, and home textiles to the U.S., while imports from the U.S. are minimal. India leads due to its globally competitive generic drug and API industry, though the U.S. also exports some high-value speciality chemicals. Another major surplus category for India is driven by exports of cut and polished diamonds, gold jewellery, and gems. The U.S. exports mainly uncut stones or raw precious metals.
India has a significant advantage, largely from seafood and shrimp exports. U.S. exports in this category are negligible. India exports more agricultural goods to the U.S., such as spices, rice, and tea, while importing limited agricultural produce from the U.S. This is one of the most balanced categories. Both countries trade machinery, but India maintains a slight surplus, possibly reflecting industrial parts and machinery exports. India’s exports are marginal, and imports from the U.S. are almost nonexistent, possibly due to trade restrictions and different sanitary standards. Plastics are one of the few categories where the U.S. slightly outpaces India, showing a narrow deficit for India, reflecting higher-value plastics or polymers imported from the U.S. The data underscores India’s comparative advantage in labour-intensive manufacturing and natural resource-based exports, while the U.S. holds strength in high-value engineered products and polymers.
To understand the depth and distribution of the tariff escalation, it is essential to examine the full structure of U.S. duties imposed during the 1 February-20 November 2025 period. The table below outlines the tiered system, combining country-specific, sector-specific, and emergency-driven measures that form the basis for the sharp increases now impacting Indian exports:
Additional tariffs are currently in effect on top of pre-January 2025 tariffs, based on presidential actions.
Percentage of Tariff | Country-specific tariffs imposed under the International Emergency Economic Powers Act (IEEPA) |
+10-41% | Ranging from 10% to 41%, Algeria 30%, Angola 32%, Bangladesh 37%, Bosnia and Herzegovina 35%, Botswana 37%, Brunei 24%, Cambodia 49%, Cameroon 11%, Chad 13%, China 34%, Côte d’Ivoire 21%, Democratic Republic of the Congo 11%, Equatorial Guinea 13%, European Union 20%, Falkland Islands 41%, Fiji 32%, Guyana 38%, India 26%, Indonesia 32%, Iraq 39%, Israel 17%, Japan 24%, Jordan 20%, Kazakhstan 27%, Laos 48%, Lesotho 50%, Libya 31%, Liechtenstein 37%, Madagascar 47%, Malawi 17%, Malaysia 24%, Mauritius 40%, Moldova 31%, Mozambique 16%, Myanmar (Burma) 44%, Namibia 21%, Nauru 30%, Nicaragua 18%, Nigeria 14%, North Macedonia 33%, Norway 15%, Pakistan 29%, Philippines 17%, Serbia 37%, South Africa 30%, South Korea 25%, Sri Lanka 44%, Switzerland 31%, Syria 41%, Taiwan 32%, Thailand 36%, Tunisia 28%, Vanuatu 22%, Venezuela 15%, Vietnam 46%, Zambia 17%, Zimbabwe 18%. (from amendment of Executive Order 14257, Annex I[1]). |
Percentage of Tariff | Sector-specific national security tariffs, Section 232 (exempted from country-specific tariffs)[2] |
+50% | on iron or steel and derivatives of steel, except for the United Kingdom, 25% |
+50% | on aluminium and derivatives; except for the United Kingdom, 25% and the Russian Federation, 200% |
+50% | on copper and derivatives |
+25% | on automobiles and parts; except for the United Kingdom (≤10%), and the European Union and Japan (≥15%) |
+10-25% | on timber, lumber and derivatives; except for the United Kingdom (10%), and the European Union and Japan (≤15%) |
+10-25% | on medium- and heavy-duty vehicles, their parts, and buses |
Percentage of Tariff | Other tariff treatment pursuant to “deals”, “unilateral preferences” and emergency measures (IEEPA)5 |
+50% | on goods from India–a 25% country-specific tariff, plus an additional 25% penalty related to oil imports from the Russian Federation |
+50% | on goods from Brazil–a 10% country-specific tariff, plus an additional 40% duty related to political reasons, if not exempted |
+0-38% | expiry of trade preferences under AGOA for sub-Saharan African economies and the Hope/Help scheme for Haiti on the 30th September 2025 |
+35% | on non-USMCA-compliant goods from Canada |
+25% | on non-USMCA-compliant goods from Mexico |
+20% | on goods from China, including Hong Kong SAR–a 10% baseline tariff, plus an additional 10% fentanyl tariff |
min 15% | on goods from Japan and the European Union, tariffs increased to 15% if they were lower; for MFN rates apply to certain products |
+10% | on non-USMCA originating potash from Canada and Mexico |
+10% | on non-USMCA originating energy-related products from Canada |
[1] https://public-inspection.federalregister.gov/2025-06063.pdf
[2] UN Trade and Development-Overview of the United States’ tariffs
Taken together, these layered tariff measures translate into sharply uneven impacts across Indian export sectors, the effects of which are detailed in the following section.
In textiles and apparel, India exported USD 8.68 billion worth of goods to the U.S. in 2024. The U.S. imposed tariffs between 45% and 50%[1] (previously 8%), effectively eliminating India’s cost advantage over competitors such as Vietnam and Bangladesh. Analysts at India Briefing (2025) estimate that these hikes could reduce exports by 7-8%, impacting over 45 million MSME workers engaged in the sector[2].
[1] US Tariff on India: Impact, Affected Products, Rates & India’s Response
The gems and jewellery industry, India’s second-largest export to the U.S., valued at USD 9.15 billion, now faces tariffs of 50%4, up from the pre-2025 rate of 1.8%. The Gems and Jewellery Export Promotion Council (GJEPC) projects losses amounting to USD 3 billion in FY2025-26, particularly impacting diamond polishing hubs in Surat and gold jewellery units in Mumbai[1]. Over 1.7 million workers are at risk due to a potential relocation of U.S. sourcing to Thailand and Hong Kong.
For pharmaceuticals and chemicals, in September 2025, U.S. President Donald Trump announced a 100% tariff specifically on branded and patented pharmaceutical products, effective since October 1[1]. General tariffs of 25% or 50% were imposed on a broader range of Indian goods, but pharmaceuticals were specifically exempted, directly impacting India’s generic drug exports, which were valued at USD ~8.72 billion every year[2]. According to the Pharmaceutical Export Promotion Council of India (Pharmexcil, 2025), the new tariffs will squeeze the profits for major exporters such as Sun Pharma and Dr Reddy’s, while U.S. healthcare costs could rise correspondingly due to reduced access to low-cost generics[3].
[2] Donald Trump’s drug tariff spares generics, but India braces for fallout
The electrical machinery and industrial equipment category, India’s largest industrial export to the U.S. at USD 18.97 billion, now faces tariffs of 30%4 (previously 1.2%). The Department for Promotion of Industry and Internal Trade (DPIIT) warns that this will erode India’s competitiveness within the China-plus-one diversification strategy, deterring investments in electronics and automotive components.
The marine and agricultural products segment, which includes exports such as seafood, spices, and basmati rice worth USD 2.3 billion, now faces tariffs of 35%4 (previously 0.7%). The Marine Products Export Development Authority (MPEDA, 2025) claimed a shrimp export reduction of 6% (from April – September 2025), due to U.S. importers shifting to Ecuador and Indonesia. This will particularly affect coastal economies in Andhra Pradesh and Gujarat. Therefore, the experts believe to emphasise the need to focus on producing and processing high-value marine products to revive the fisheries sector[1].
The locomotives, aircraft, and ships segment, covering India’s exports of railway locomotives, aircraft components, and marine vessels valued at USD 3.33 billion, now faces significantly higher U.S. tariff barriers, rising to around 50%6. However, tariffs on aircraft and aircraft components remain minimal or even zero, and, similar to aircraft, India exports very few large fully assembled ships to the U.S. market.
It is self-explanatory that these steep tariff increases, particularly on locomotives and related engineering goods, may prompt U.S. buyers to shift procurement to suppliers in Europe and East Asia. This could erode India’s competitiveness in high-value engineering exports, potentially resulting in substantial revenue losses for Indian manufacturers. The impact would be felt most in the major production clusters of Maharashtra, Tamil Nadu, and Karnataka, where heavy engineering industries are concentrated.
Economic Fallout: Exports in Jeopardy
The sectors most exposed to the tariff blow are precisely those that employ millions of Indian workers. Textiles, leather goods, gems and jewellery, automotive components and machinery will now face prohibitively high duties in their largest export market. For Indian exporters already grappling with tight margins and a strong rupee, this change could be the difference between survival and shutdown.
According to GTRI, due to these tariff increases, shipments dropped to USD 6.31 billion from USD 8.38 billion[1] between May and October 2025, coinciding with the US duties rising from 10% in April to 25% in early August to 50% by late August. The World Bank (2025)[2] projects a 6.3% reduction in Indian exports by FY26-27, saying the impact of US tariffs will dampen growth expected from the cut in GST rates and taxes.
By October 2025, reports from Bloomberg indicated that Washington may reduce tariffs to 15-16% under a proposed bilateral trade recalibration[1]. The draft framework involves reciprocal commitments: India would grant greater U.S. agricultural access (corn, soymeal, and dairy derivatives[2]), while the U.S. would restore Generalised System of Preferences (GSP) benefits and moderate its stance on India’s Russian oil imports. Minister Goyal reiterated that “no deal will be made under pressure” (Hindustan Times, Oct 2025), highlighting India’s sovereignty-first policy stance. Meanwhile, domestic industry bodies such as CII and FIEO have urged the government to extend export subsidies and insurance credit to buffer short-term shocks.
[1] US May Cut India Tariff to 15-16% in Trade Deal
[2] Indian Market Opens for US Farm Goods as Trade Agreement Moves Forward
Next Steps for India to Curb the U.S.-India Tariff War:
A. Trade Architecture & FTA-Driven Measures:
- Pursue Early Harvest Agreements: Secure quick tariff stabilisation in mutually dependent sectors, APIs, electronics components, and medical devices before a full FTA.
- Negotiate Zero-Tariff Corridors for Critical Goods: Create tariff-free pathways for essential items (pharma APIs, clean energy components, data-centre hardware) to ensure continuity of supply.
- Fast-Track Regulatory Alignment for Key Export Sectors: Accelerate U.S. approvals in pharmaceuticals, electronics, and digital equipment in exchange for predictable tariff schedules.
- Integrate Value Chains with USMCA (Mexico & Canada): Co-produce goods where rules of origin permit partial Indian inputs, enabling tariff-free U.S. entry under USMCA.
- Establish a Joint Tariff Review Mechanism under TPF: Create a technical body to anticipate tariff spikes, detect supply-chain harm, and jointly recommend rollbacks.
B. Sector-specific steps:
Sector | Strategy to be adopted |
Textiles & Apparel | 1. Negotiate TRQs or Tariff Exemptions for Cotton & MMF Garments: |
Leather & Footwear | 1. Increase Value-Added Production: |
Gems & Jewellery | 1. Promote Cutting, Polishing & High-Value Design Exports: |
Automotive Components & Machinery | 1. Advance Precision Engineering & Component Upgrading: |
Marine Products (Seafood, Shrimp, Fishery Exports) | Marine: |
Agricultural Products | Agriculture: |
C. Supply-chain integration with the U.S.:
- Promote co-production and joint manufacturing Collaborate with U.S. firms in defence, aerospace, clean-tech, and electronics, making products jointly produced and less likely to face tariffs. In case of defence, India and the U.S. have a decade-long strategic defence framework in place to encourage collaboration on manufacturing and technology sharing. A key example is the planned co-production of GE 414 aero-engines in India. For aerospace, India’s growing aerospace industry, driven by domestic demand for commercial aviation and defence needs, provides a strong incentive for U.S. companies to partner on manufacturing and MRO (Maintenance, Repair, and Overhaul). Electronics and Clean-Tech as a sector are also key areas for collaboration, as India aims to become a global manufacturing hub and attract foreign investment.
- Expand U.S. investments through targeted PLIs Attract U.S. companies in semiconductors, renewables, and electronics to deepen bilateral supply-chain interdependence. For the semiconductors, India is actively working to build its semiconductor manufacturing ecosystem, as evidenced by the recent focus on the sector and the potential for U.S. investment and technology transfer. Renewables in India have set aggressive renewable energy targets and are attracting significant international investment, making it an attractive market for U.S. companies in this sector. The goal of the supply-chain interdependence initiatives is to create deeper, more resilient supply chains between the two countries, reducing reliance on single sources and creating new opportunities for growth in high-tech industries
India now stands at a decisive juncture in its economic engagement with the United States. The tariff escalation, broad, steep, and sectorally uneven, has exposed the vulnerabilities of labour-intensive and high-value export segments while underscoring the limits of existing trade safeguards. Yet it also provides a moment for strategic recalibration. By pursuing targeted early-harvest arrangements, rebuilding cost competitiveness, accelerating market diversification, and deepening supply-chain integration with North America, India can both cushion immediate disruptions and reshape its long-term export trajectory. The coming phase of negotiations will be critical: India’s response must balance firmness with flexibility, ensuring that short-term shocks evolve into opportunities for structural strengthening rather than a prolonged economic rift.